


The Hot Hand in Counting
To Infinity ...

About a month ago, thinking that my mathematical modeling and computation were complete, I started drafting an article about the distribution of the number of battle deaths occurring in a war and how this distribution has changed over the past two centuries. But after returning from our annual wilderness canoe camping trip, I discovered that I’d have to carefully revise all of my work because the parameter estimates almost always corresponded to an expected value of an infinite number of war fatalities!
In this article, I present the Potentially Terminating Unit Increment (“PTUI”🤪) model, a specific type of Counting Process Model. Basically, start at zero and count until you stop.
Formally, a PTUI can be represented as N(t), a discrete time1 stochastic function for which:

That is, T is a random variable designating the number at which you stop counting. A specific PTUI is defined by the probability that you stop counting.
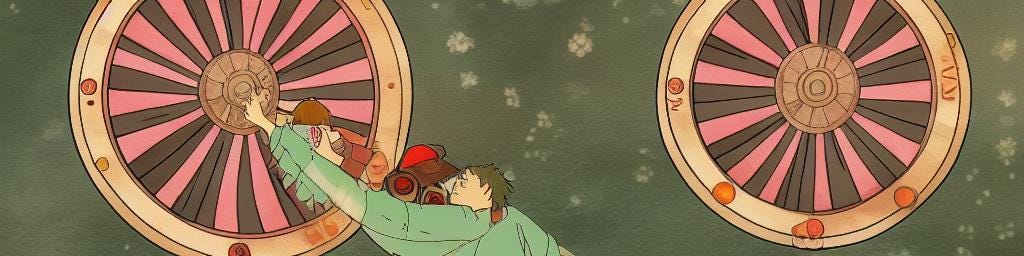
Spin, Spin!
The simplest PTUI is when the stopping probability is a constant, p. Think of the Wheel of Fortune TV show: disregard the word puzzle and just see how many times you can spin the wheel until you land on ‘Lose A Turn’. The smaller the width — more precisely, radial angle — of ‘Lose A Turn’, the more spins you’re likely to go.
In principle, you might never hit ‘Lose A Turn’, but the probability that you exceed n spins decreases geometrically with respect to n: Pr[T≥n]=(1-p)^n; T follows a geometric distribution. As long as p>0 (i.e., strictly positive), the expected value of T is finite: E[T] = 1/p.
Pólya’s Urn
For my war fatality analysis, I developed a model in which the stopping probability decreased as you counted higher. Before describing that model, consider the classic probability theory visualization of randomly drawing colored balls from an urn. In this case, start with some green (“go”) balls and one red (“stop”) ball. Count the number of green balls you draw before you draw the red ball … but each time you draw a green ball, put it back in the urn … and drop one additional green ball in the urn. This is special case of Pólya’s Urn.
So the higher you count, the lower the probability that you’ll stop: p isn’t a constant; instead, p(t) = 1/(G+t), where G is the original number of green balls. The probability that you’ll stop is always strictly positive, and furthermore, you are certain — probability 1 — to eventually draw a red ball. But even if we start with just one green ball in the urn, our expected number of draws is infinite.2 Hot Hand in Counting achieved!
Urn Plus Wheel
To investigate the distribution of fatalities in the Correlates of War Project data, I imagined that the fatality count in each war was generated by a simple PTUI, i.e., with a fixed stopping probability … but each war could have a different stopping probability.
Think of an urn holding balls labeled with stopping probabilities, plus an adjustable wheel of fortune. Then to generate the fatalities in a single war: (1) draw a ball from the urn, (2) adjust the radial angle of ‘Lose A Turn’ to match the ball’s labeled stopping probability, (3) start spinning the wheel.
The technical term for the output of this two-apparatus device is a mixture of geometric random variables.
I applied the Expectation-Maximization algorithm to my model for the whole dataset as well as a few historical periods to get an idea of how the stopping probabilities might be distributed. I found that stopping probabilities followed a power law:

Roughly speaking, the likelihood of a given stopping probability has been proportional to a power of that stopping probability.3
Silly me, I assumed that (a) since all of the stopping probabilities are strictly positive — corresponding to a finite expected number of fatalities for each draw, and (b) since α was always positive — i.e., smaller stopping probabilities were less likely — the expected value of mixture would be finite.
However it turns out that when the stopping probability shrinks fast enough, in this case, when α≤1 — which my Recursive Bayes estimate showed was the case during most of the past two centuries — the expected value is infinite.4
Uh oh! Both for humanity, and my model.
We Can’t Go On Forever
We can draw an infinite number of (green) balls from a conceptual urn, but an actual war can only kill a finite number of humans.
My fairly simple remedy for this oversight will be to ‘cap’ the distribution, viz., set the maximum possible value of T to W, the world population at the start of the war. You might quibble that I should add the number of births during the war to the cap, but this makes a minuscule difference because the expectation increases with the logarithm of the cap:
For example, let’s cap our special case Polya’s urn: let X(G,W) represent number of green balls we draw from the urn when we start with G green balls and stop if we draw W green balls before drawing a red ball. Then X(1,2^30) = 20.37 while X(1,2^31) = 21.06 = 20.37 + ln 2.5
The world’s population has nearly quintupled over the past two centuries, but this only adds a couple of fatalities to the single war expectations, which are more conveniently measured in tens of thousands.
The PTUI Perspective
I formulated the mixture of geometric random variables model because it’s relatively easy to work through the math and computation. But when a war begins, we don’t actually get to see the stopping probability drawn from the (conceptual) urn. Instead, the war’s fatalities are more naturally viewed as a counting process: replace the urn + spinner with an adjustable spinner and reduce the width of ‘End Of War’ each time you avoid landing on it.6
My empirical finding that α is often less than 1 corresponds to the distressing interpretation that as the fatality count rises, the wedge shrinks pretty fast. Any skirmish may initially seem limited but could escalate into a major conflict. A sobering thought I’ll explore once I complete my re-analysis.
Fine point: don’t think of t as clock time; it’s just ‘counting time’.
This infinite expectation is related to the divergence of the harmonic series.
I’m leaving out the technical details needed to convert this into a probability density function.
This infinite expectation is even more closely related to the divergence of the harmonic series.
2^30 is just over one billion, close to Earth’s population two centuries ago; the natural logarithm of 2 is approximately 0.69.
The shrinkage formula turns out to be a super-complicated expression involving, according to Mathematica, functions such as Hypergeometric2F1Regularized that I’ve never encountered before … which is why the mixture perspective is more convenient for math and computation.